Tuesday, May 19, 2026
News and Views from the Global South
Opinion
The Geography of Poverty
Jomo Kwame Sundaram was United Nations Assistant Secretary-General for Economic Developmentand received the Wassily Leontief Prize for Advancing the Frontiers of Economic Thought in 2007

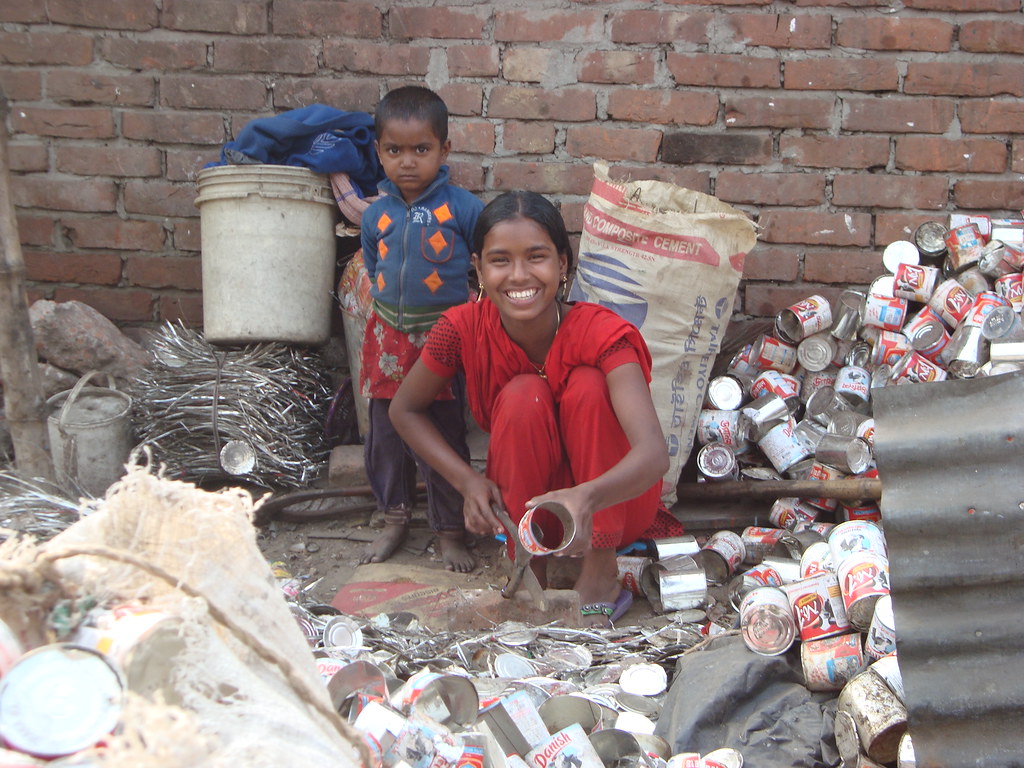
Batara slum in a Dhaka suburb. Credit: Naimul Haq/IPS
- World leaders agreed in 2000 to halve the number of people living in poverty by 2015. The poverty line was defined as the purchasing power parity (PPP) equivalent to a US dollar a day, later adjusted to the 2005 PPP equivalent of $1.25 daily in 2008 to the 2012 PPP equivalent of $1.90 daily in 2015. As the cost of living rise unevenly across the world, the World Bank periodically updates the global poverty line to reflect these changes. Nevertheless, there are many concerns about how the line was defined and has been revised over the decades.
According to the most recent estimates of the World Bank, 12.7 per cent of the world’s population lived at or below $1.90 a day in 2012, compared with 37 per cent in 1990 and 44 per cent in 1981. This means that in 2012, 896 million people lived on less than $1.90 a day, compared with 1.95 billion in 1990, and 1.99 billion in 1981.
Global progress in reducing extreme poverty over the last three decades has been modest and uneven across the regions. East Asia saw the most dramatic reduction in extreme poverty, from 80 per cent in 1981 to 7.2 per cent in 2012, mainly due to rapid growth in China since the 1980s that saw its poverty rate decline from 66.6 per cent in 1990 to 18.8 per cent in 2005 and around 10 per cent in 2012. In South Asia, the share of the population living in extreme poverty dropped from 58 per cent in 1981 to 18.7 per cent in 2012. But extreme poverty in Sub-Saharan Africa has hardly declined, standing at around 42.6 per cent in 2012.
Even though poverty rates have declined, a large number of people still live in abject poverty. For example, in 2012, there were about 140 million poor in China alone, 309 million in South Asia and 388.7 million in Sub-Saharan Africa.
The measurement of poverty declines does not tell us how far below the poverty line the remaining poor are. Unfortunately, many are currently very far below it in Sub-Saharan Africa. The average consumption of Africa’s poorest people is only about 70 cents a day—barely more than it was 20 years ago. Even 20 more years of progress will not move the remaining millions out of poverty in Africa. At current growth rates, a quarter of Africans will still be consuming less than $1.90 a day in 2030.
Moreover, progress has been slower with higher poverty lines. Over 2.1 billion people in the developing world lived on less than $3.10 a day in 2012, compared to 2.9 billion in 1990. Over this period, the share of the population living under that level nearly halved, from 66 per cent in 1990 to 35 per cent in 2012.

Jomo Kwame Sundaram. Credit: FAO
A large number of people may not be defined as poor, but they may nevertheless be very vulnerable. For those earning just above the extreme poverty line ($1.90 a day), progress can be temporary: economic shocks, food insecurity, and climate change threaten to rob them of their hard-won gains and force them back into poverty.
In addition to income, wide- ranging deficits in the human condition remain pervasive, not only in most low-income countries but also in many middle- income countries. Access to basic education, healthcare, modern energy, safe water and other critical services, often determined by socioeconomic status, gender, ethnicity, and geography, remain elusive for many.
Africa’s share of global poverty soars
The distribution of people living in poverty within and across regions has changed over the past three decades. While about 57 per cent of the world’s poor lived in East Asia and the Pacific in 1981, the sub-region was home to only around 16 per cent of the global poor in 2012.
In contrast, Sub-Saharan Africa’s share of the world’s poor increased dramatically from 10.7 per cent in 1981 to around 41 per cent in 2012. South Asia’s share increased from 29 per cent in 1981 to 39.5 per cent in 2012 despite the poverty rate in South Asia falling by half. Poverty is often attributed to economic growth. But despite impressive growth during 1990-2008, India’s poverty rate only declined from 51 per cent to 37 per cent.
Most of the poor are not in poor countries
In 1990, 93 per cent of the world’s poor lived in low- income countries (LICs). In 2007-2008, 75 per cent of the world’s approximately 1.3 billion poor lived in middle-income countries (MICs), while about a quarter of the world’s poor, approximately 370 million, lived in the 39 LICs, largely in sub-Saharan Africa. According to the World Bank’s recent estimates, the MICs’ share of global poverty stands at 73 per cent. Clearly, most of the world’s poor no longer live in LICs.
Only five countries (China, India, Pakistan, Indonesia, Nigeria) account for much of this shift as these MICs are no longer considered LICs. Besides China and India, the share of global poverty accounted for by other MICs has risen from 7 to 22 per cent. Fragile LICs’ share of global poverty did not move much; they accounted for at least 12 per cent of the world’s poor in 2011, compared to 13 per cent during the late 1980s. Ironically, poverty is pervasive in natural resource based (NRB) countries, accounting for 37 per cent of global poverty, despite the recent decade-long resource price boom. The combined share of the world’s poor living in natural NRB and fragile and conflict-affected (FCS) countries in 2011 was about half.
Growing inequality has meant that rising tides have not lifted all boats, especially of the poor. Not only have there been widening income gaps between countries of the North and South until recently, but within-country income inequalities have also increased in most countries.
Multidimensional poverty
The experience of poverty is increasingly seen as ‘multidimensional’. A wider understanding and definition of poverty, adopted by the 1995 Copenhagen World Summit for Social Development, includes deprivation, social exclusion and lack of participation. Using this broader definition, the situation appears worse than what the monetary income poverty line would suggest.
For example, according to UNDP’s new Multi-dimensional Poverty Index (MPI) of ten indicators of social development, first used in the Human Development Report 2010, which considered 104 countries that had data for 78 per cent of the world’s population, there are 1.7 billion poor, of whom 51 per cent live in South Asia and 28 per cent in sub-Saharan Africa.
The Human Development Report 2015 covered 101 countries and found almost 1.5 billion —about 29 per cent of their total population — experience (multidimensional) poverty, with at least 33 per cent of the indicators reflecting acute deprivations in health, education, and standard of living. And close to 900 million people are vulnerable to falling into poverty when financial, natural or other setbacks occur. The latest (June 2015) findings of the Oxford University-based Poverty & Human Development Initiative suggest that of the 1.6 billion people in multidimensional poverty, 54 per cent live in South Asiaand 31 per cent in Sub-Saharan Africa.
Interestingly, most (62%) MPI poor people do not live in failed states, although in countries classified as “in very high alert” by the Fragile States Index, 72 per cent are multi-dimensionally poor. Most – 70% – MPI poor people live in MICs. The MPI reveals a starker situation than the $1.90-a-day poverty line. For example, in Chad and Ethiopia, the incidence of MPI is about 87 per cent, whereas, for $1.90/day poverty, it is only 37 per cent.
Nearly half – 736 million people — of all the MPI poor live with such extreme deprivations – like severe malnutrition or no more than one year of education in the household – that they should also be considered destitute.
The disparities between the two trends compels us to be more modest in claiming too much progress against poverty, and reminds us of the many dimensions of the ongoing struggle to make meaningful progress for all who continue to live in poverty as well as those who are no longer deemed poor, but remain very vulnerable to slipping back. The challenge appears to be especially great in South Asia and sub-Saharan Africa.
 Print
|
Print
|

Pictures for this story
This story includes downloadable print-quality images -- Copyright IPS, to be used exclusively with this story.